
Understanding deep learning representations with applied explainability
As someone deeply involved in deploying deep learning systems to production, I keep encountering the same challenge: models can be highly accurate and still fundamentally difficult to trust. When they fail, the reasons are often opaque. Internal representations are hard to reason about, hidden failure modes emerge late, and many post-hoc explainability tools stop at surface-level signals without answering a more fundamental question: what has the model actually learned?
This question was very much on my mind at ICCV, where I attended a talk by Thomas Fel. His presentation immediately stood out. The way he covered the space- both technically and philosophically- was precise, rigorous, and deeply thoughtful. He framed interpretability not as a visualization problem or an auxiliary debugging step, but as a way to reason about models at the level where decisions are formed: their internal representations. That framing resonated strongly with me.
Interpreting models through internal representations
In his NeurIPS 2023 paper, Thomas and his co-authors introduce Inverse Recognition (INVERT), a method for automatically associating hidden units with human-interpretable concepts. Unlike many prior approaches, INVERT does not rely on segmentation masks or heavy supervision. Instead, it identifies which concepts individual neurons discriminate and quantifies that alignment using a statistically grounded metric. This enables systematic auditing of representations, surfacing spurious correlations, and understanding how concepts are organized across layers- without distorting the model or making causal claims the method cannot support.
From research insight to applied practice
This line of work aligns closely with how we think about applied explainability at Tensorleap. For practitioners, interpretability only matters if it leads to action: better debugging, more reliable validation, and clearer decision-making around models in real systems. Representation-level analysis addresses a critical gap- cases where a model appears to perform well, but for the wrong reasons.
Beyond the research itself, Thomas is also a remarkably clear and insightful speaker. That was a key reason I invited him to join us for a Tensorleap webinar. Our goal was not to simplify the research, but to explore how these ideas translate into practical insight for engineers working with complex models in production.
If you’re grappling with understanding what your models have learned, or why they fail in unexpected ways, I strongly recommend watching the full webinar recording to dive deeper into representation analysis and applied interpretability.
Related posts

Model Atlas- a New Way to Navigate Large-scale Model Repositories
When most teams think about models, they think one model at a time.
But the reality has shifted. Public model repositories now contain millions of models and that scale creates a new kind of problem: even when models are freely available, understanding how they relate to each other is surprisingly difficult. Documentation is often incomplete. Lineage is fragmented. And search or tags will only take you so far.
That's what made my conversation with Eliyahu Horwitz so worth having.
The hidden complexity of large model repositories
In this webinar, we explored Model Atlas- a framework for representing large model repositories as a connected graph of models, attributes, and weight-space transformations like fine-tuning. The goal isn't just neater organization. It's making the ecosystem itself legible: seeing how models branch, cluster, evolve, and inherit from one another at scale.
From better search to better visibility
If you work with open model ecosystems, this reframes what "better" actually looks like. Not just better search, but genuine visibility into the structure of the model landscape itself. If that sounds like a problem worth solving, the full conversation is worth your time.
The Autonomy Paradox: Proven Technology That Won’t Scale
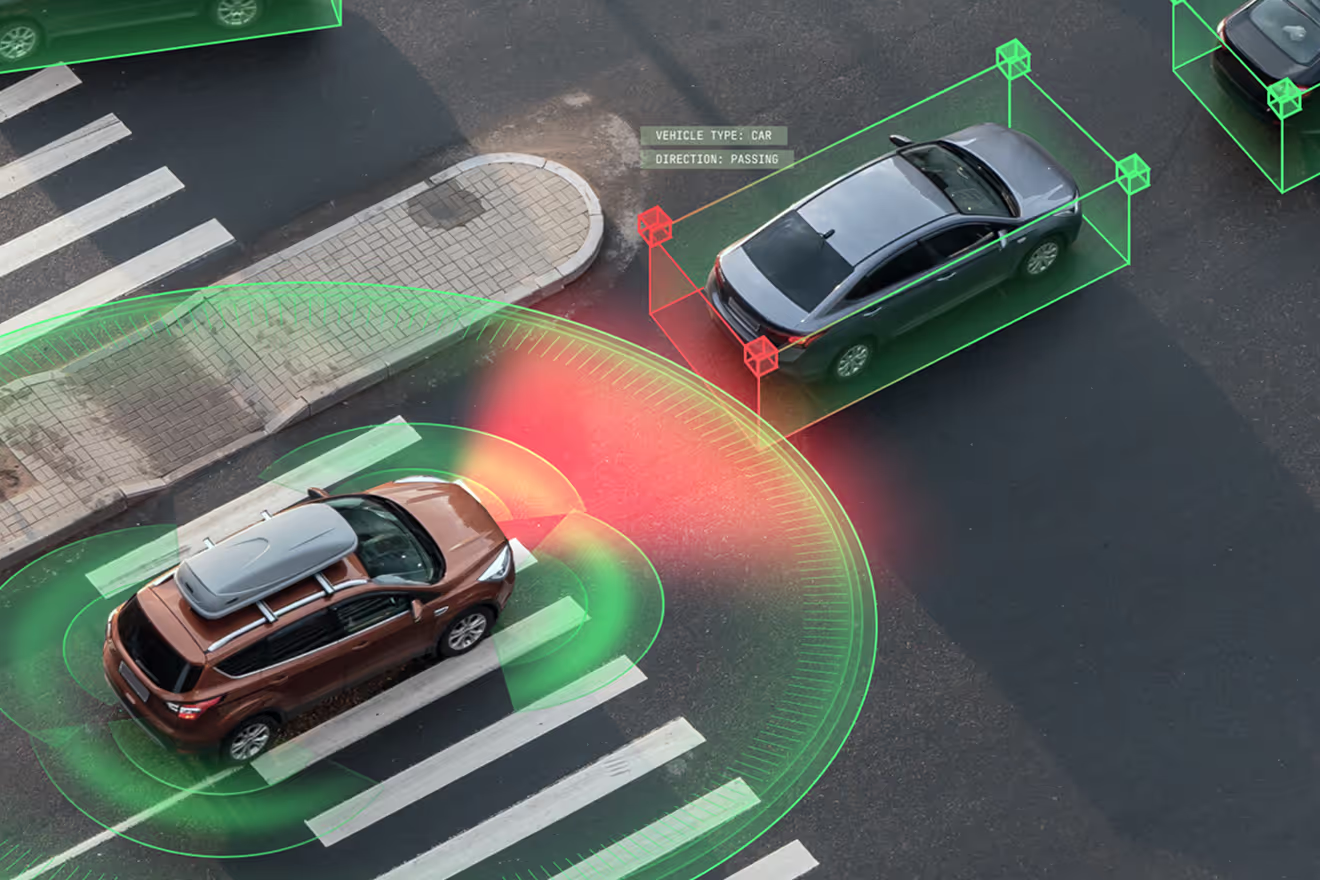
Autonomous driving systems are no longer experimental. Modern perception and planning models perform reliably. Pilots succeed. Early deployments confirm that the technology itself works. And yet, when teams try to scale to new regions, broader conditions, or even routine software updates- progress slows sharply.
Nothing is obviously broken. But confidence in system behavior doesn’t scale with deployment.This is the autonomy paradox many teams face today: you’ve cleared the hardest AI milestone, yet every expansion still feels fragile.
Problem #1: The selective unreliability trap
The first sign of trouble rarely looks like failure. Instead, it shows up as selective unreliability- behavior that is correct most of the time, but inconsistent under specific conditions.
A system that performs well overall begins to behave differently when:
- Lighting or weather changes
- Road layouts vary by geography
- Sensors drift over time
- Models are retrained or optimized
These behaviors are rarely catastrophic. They are subtle, localized, and hard to reproduce. They often escape aggregate metrics and only surface after deployment.
From the outside, performance looks stable.From the inside, teams lose confidence in where the system can actually be trusted. Selective behaviors are hard to reproduce and even harder to explain. Left unaddressed, they can escalate beyond engineering teams, triggering investigations and, in some cases, even recalls.
The hidden cost of “almost working” autonomy
“Almost working” systems impose a cost that compounds quietly. When behavior cannot be clearly bounded, organizations slow down by necessity:
- Rollouts become conservative
- Validation cycles stretch
- Each update requires renewed scrutiny
Validation effort grows faster than deployment velocity.
The result isn’t failure- it’s drag. Autonomy programs continue to absorb engineering and validation resources while delivering limited incremental progress. Over time, this imbalance weakens momentum, even as the underlying models continue to improve.This is not a technology problem. It’s an operational problem.
Problem #2: Strong metrics don’t matter at scale
Most autonomy teams rely on performance metrics to guide decisions.Metrics answer one question well: How does the system perform on average?
They fail to answer the questions that matter in production:
- Where does behavior break down?
- Under what conditions?
- And why does the model act the way it does?
A system can score well while relying on fragile signals, correlations that hold in training data but break under real-world variation. These failures often affect small slices of data, yet carry outsized operational and safety risk.
When behavior degrades, metrics confirm the regression but they don’t explain it. Aggregate scores offer reassurance, not control. And reassurance does not scale.Even mature systems can look stable while failing in narrow slices, and when those slices intersect with real-world edge cases, the consequences are no longer theoretical. The last thing anyone needs is a rare condition that slips through validation and leads to real harm.
Why the current autonomy development model breaks down
Most autonomy programs follow a familiar pattern:
- Train better models
- Expand testing
- Add safeguards
- Re-validate before release
This works when failures are obvious and repeatable.
It breaks when failures are rare, conditional, and context-dependent , which is exactly the environment production autonomy operates in.
When teams don’t understand why behavior changes, the only available response is more testing and tighter constraints. Over time, validation effort balloons while deployment slows.The bottleneck is no longer model quality. It’s lack of operational understanding.
The missing layer: operational understanding of model behavior
What autonomy teams increasingly need is not more data or stronger models.They need operational understanding- visibility into how models behave across conditions, environments, and versions.
That means being able to answer:
- Where does the system behave reliably?
- Where does it become brittle?
- What signals actually drive its decisions?
This requires going beyond aggregate metrics to techniques that expose behavior directly, such as analyzing latent representations, identifying systematic error slices, and attributing decisions to meaningful concepts rather than surface correlations.
Operational understanding turns unknown risks into explicit boundaries. It allows teams to reason about behavior before deployment instead of discovering limitations through incidents.This is the foundation for scaling autonomy predictably.
From metrics to behavior: what it takes to scale autonomy
Scaling autonomy requires a shift from optimizing models to understanding and controlling behavior.
At production scale, the key question is no longer “Is the model accurate?” but “How does its behavior change across conditions, environments, and versions?” Teams need to know where decisions are consistent, where they degrade, and why.
That means moving beyond aggregate metrics to practices that make behavior observable and actionable:
- Audit model behavior, not just performance
- Track behavior across versions
- Make generalization explicit
- Close the loop between insight and action
Together, these practices form what we refer to as applied explainability: not explainability as a research artifact, but an operational approach to deep learning debugging. Applied explainability makes model behavior visible in real terms, exposing which signals drive decisions, where generalization breaks, and how changes impact behavior before deployment.
When behavior can be inspected, compared, and acted on, validation stops being a repeated reset. Confidence accumulates across releases. Scaling becomes a controlled process rather than a gamble. This is the foundation for moving from experimental AI to production-grade autonomy.
Beyond the Black Box: Proactive Debugging for End-to-End Autonomous Driving
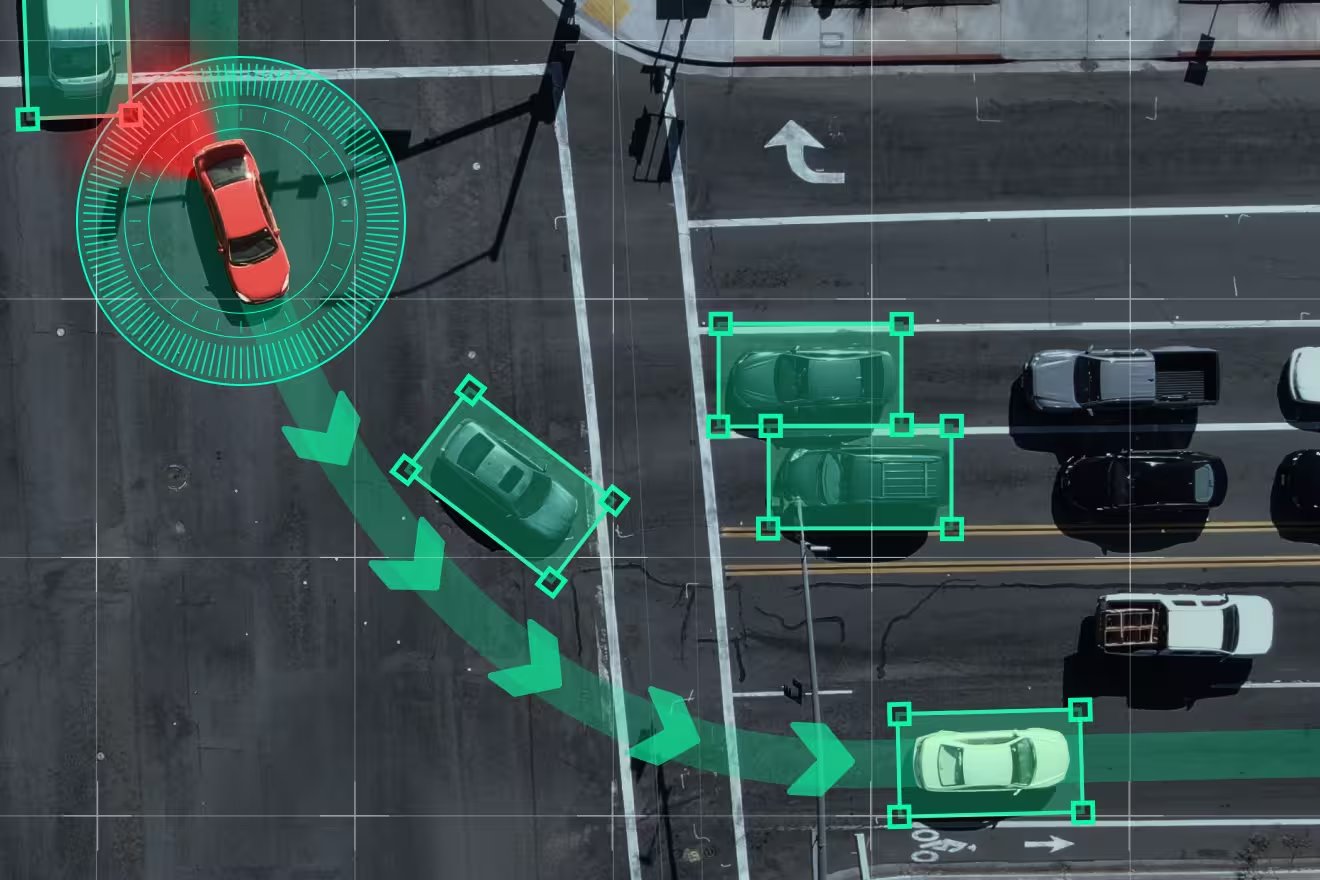
In a modular autonomous driving pipeline, a failure is usually a process of elimination: you can point to a missed detection or a bad tracking label and know exactly what went wrong. But End-to-End (E2E) models change the rules. By mapping raw sensor data directly to driving actions, they trade that clear, step-by-step visibility for better scalability.
Collapsing perception and planning into a single neural network fundamentally changes how failures manifest. In E2E systems, failure mechanisms are no longer explicit or traceable to a specific component; instead, they are embedded in the model’s internal representations. This makes it significantly harder to understand when, where, and why the policy breaks down. As these systems mature, ensuring safety requires a shift in focus: we must analyze the internal model structure, not just closed-loop driving outcomes.
Why closed-loop evaluation is not enough
Closed-loop metrics such as success rate, collisions, interventions, remain essential for evaluating end-to-end driving systems. But they primarily capture outcomes, not causes.
In practice, E2E policies fail under specific combinations of visual appearance, geometry, and context. These failures are sparse and structured, and are often masked by aggregate performance numbers. A model can perform well on average while remaining brittle in precisely the edge cases that dominate safety risk.
This creates a diagnostic gap: closed-loop evaluation tells us that a failure occurred, but offers limited insight into the internal conditions that led to it. Bridging this gap requires tools that expose how the model internally organizes driving-relevant scenarios.
Latent space as a debugging lens
We use latent space analysis to study how failure modes in an end-to-end driving model emerge, organize, and persist.
Our analysis uses the PlanKD implementation of Interfuser, a multi-input transformer-based end-to-end driving model trained and evaluated in the CARLA simulator. To study robustness to sensor variation, we also include data from the Bench2Drive (B2D) dataset, which is CARLA-native but employs a different sensor configuration. This allows us to analyze how sensor-induced domain gaps are reflected in the model’s latent representations.
Exploring failure structure in end-to-end driving models
Exploring a model’s latent space gives a direct view into how it organizes driving-relevant concepts and where that organization begins to break down.
Semantic structure and failure regions
We start by looking at how the model’s latent space organizes related but distinct semantic concepts. Figure 1 visualizes the same latent space under two different semantic overlays: scenes containing red traffic lights, and scenes in which the ego vehicle is inside a junction.
In the red-light view, we’ve seen that these scenes form a compact cluster, suggesting the model has learned a coherent internal representation for this concept. At the same time, red-light scenes that fall outside this cluster consistently show higher traffic-light prediction loss.
What stands out is that these failures are not random outliers. They emerge when visual or geometric variations violate the model’s learned invariances, pushing scenes outside the region of representation space where the policy is well supported by training data.
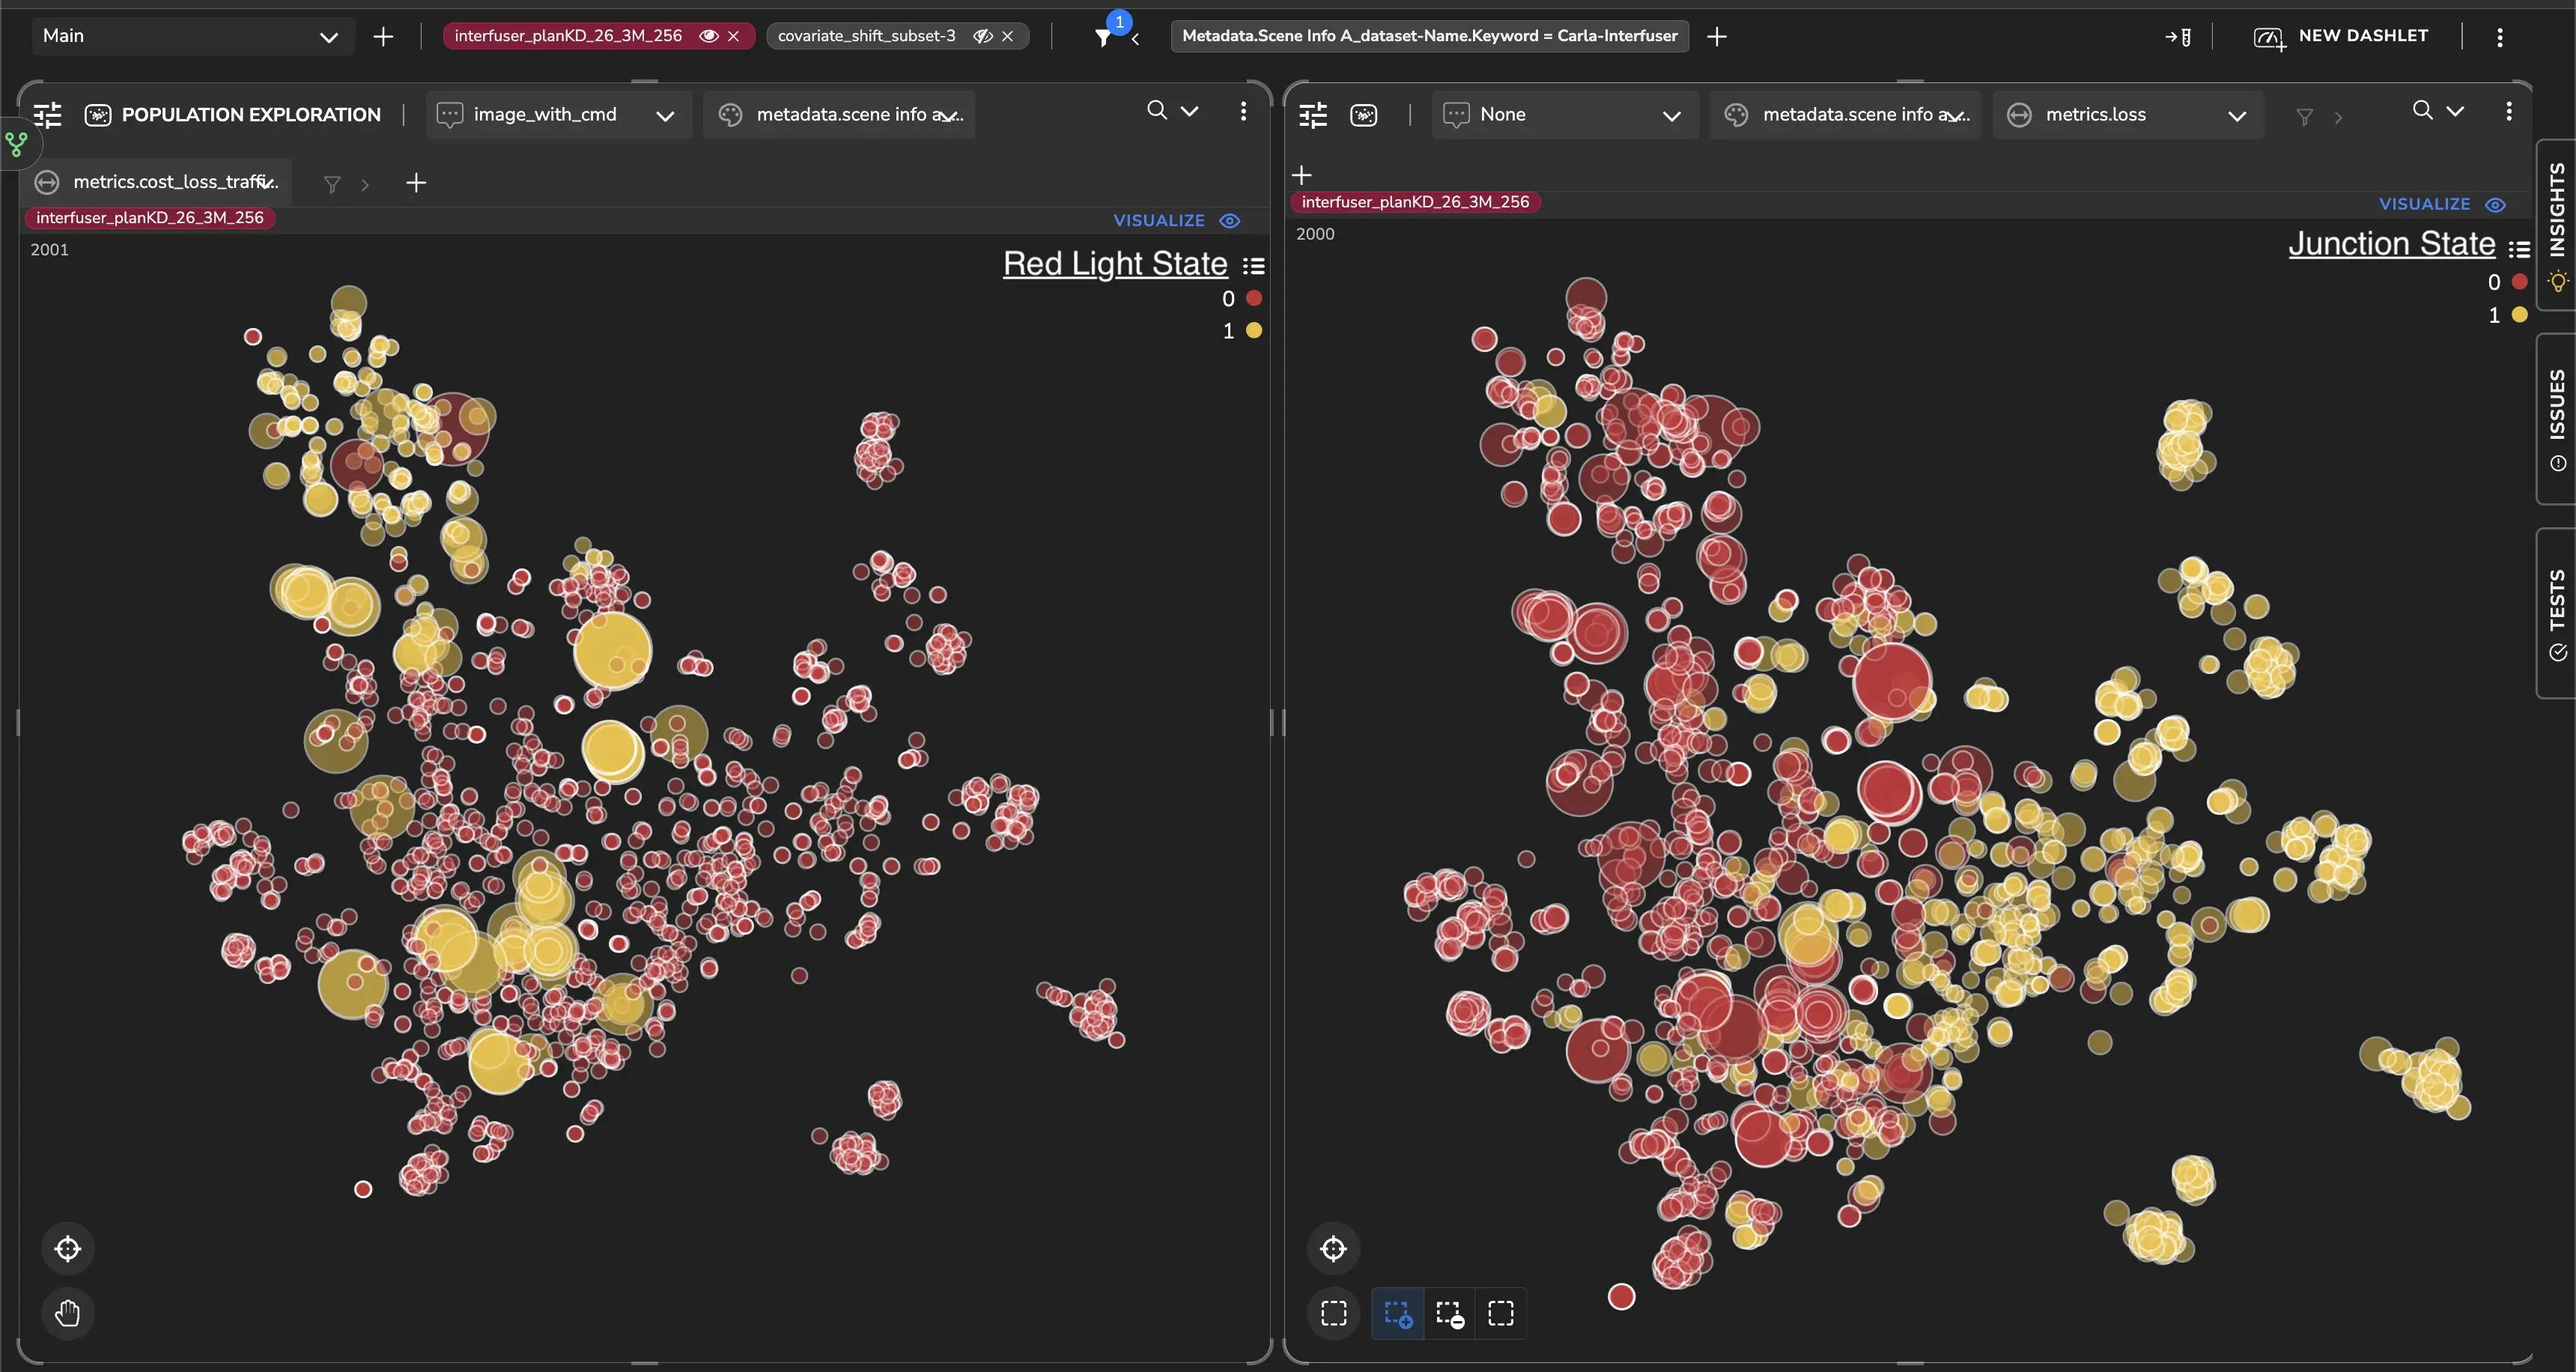
Figure 1. Latent structure of red traffic light scenes: Side-by-side latent-space visualizations highlighting different semantic attributes. Left: scenes containing red traffic lights (yellow markers). Right: scenes in which the ego vehicle is inside a junction (yellow markers). In the red-light view, samples outside the main cluster correspond to higher traffic-light loss, revealing structured failure regions rather than isolated errors.
Behavioral organization: trajectory geometry
Latent space structure also reveals how the model organizes driving behavior. By probing activations immediately before waypoint prediction, we’ve seen a clear separation between left-turning, straight, and right-turning trajectories.
Within each trajectory regime, the latent space is smoothly ordered by target distance, forming a continuous progression from near to far waypoints. This shows that the model encodes both trajectory geometry and planning horizon in a structured way, largely independent of explicit navigation commands.
One notable detail is that left and right turns are not represented symmetrically. These asymmetries likely reflect biases introduced by driving rules and data collection, for example, differences in turn frequency, yielding behavior, and interaction patterns. Making these biases visible at the representation level provides concrete guidance for targeted evaluation and data balancing.
.webp)
Domain gap in end-to-end autonomous driving
In end-to-end driving systems, perception and control are learned jointly, tightly coupling internal representations to the sensor configuration used during training. Changes in camera placement, resolution, field of view, or LiDAR sampling induce structured shifts in latent space, even when the environment and task remain the same.
This effect becomes clear when comparing representations derived from Interfuser and Bench2Drive data. Although both are CARLA-native and target similar driving tasks, their different sensor configurations lead to systematic differences in visibility and spatial sampling, which show up as a clear separation in latent space.
At the representation level, domain gap analysis shifts the focus from whether a model fails to why it fails, enabling earlier identification of sensor-induced biases before they surface as closed-loop performance degradation.
.webp)
Covariate shift in imitation learning
A fundamental challenge in imitation learning (IL) stems from how supervision is structured. Policies are trained on expert demonstrations that cover only a narrow subset of the state–action space. While perception may generalize broadly, action supervision remains sparse and localized around expert trajectories.
Although covariate shift formally emerges only at deployment time, its root cause can be identified offline through representation-level analysis.
By comparing latent spaces extracted from different depths of the network, we’ve seen cases that lie well within the dense training distribution at early encoder layers but appear as clear outliers near the waypoint predictor. This perceptual–action mismatch highlights states where the model recognizes the scene but lacks reliable action grounding, making it especially vulnerable to compounding errors during closed-loop execution.
Because this failure mode arises from the encoder–decoder structure and action-level supervision inherent to IL, it persists across datasets and architectures.
.webp)
Long-tail failures from spurious visual correlations
End-to-end policies implicitly assume that visual correlations learned during training will generalize at deployment. In the long tail, this assumption can break down.
Latent space analysis reveals a small cluster of red-light scenes associated with disproportionately high prediction loss. This cluster is not town-specific, pointing to a recurring contextual pattern rather than an environment-dependent artifact. Looking at scene metadata and images, we’ve seen strong associations with specific weather conditions and repeated co-occurrence of red traffic lights with other visually salient red objects near intersections.
In these cases, the model allocates disproportionate attention to irrelevant red features, sometimes at the expense of dynamic agents such as pedestrians.
.webp)
To isolate this effect, we compare two CARLA junction scenes generated under the same weather condition with similar traffic configurations. The primary difference between the scenes is the presence of a red object near the intersection. Despite minimal changes, the model’s feature emphasis shifts toward the red object, accompanied by a sharp increase in traffic-related prediction loss.
This example captures a characteristic long-tail failure mode: it affects a small fraction of scenes, emerges only under specific visual configurations, and remains largely invisible to aggregate performance metrics despite its safety relevance.
From reactive testing to proactive debugging
Failures in end-to-end autonomous driving systems are rarely random; they are the structured results of subtle representation gaps, domain shifts, or supervision limitations. Because E2E models consolidate perception and planning, these failure mechanisms don't appear as discrete component errors. Instead, they exist as complex patterns within the model’s internal logic, making them difficult to isolate through standard outcome-based testing.
Ultimately, debugging end-to-end autonomous driving models requires shifting from reactive closed-loop testing to proactive internal analysis.
By surfacing hidden failure patterns like covariate shift and spurious correlations before they manifest on the road, engineering teams can move away from the "trial-and-error" cycle of simulation and toward a precision-driven strategy for data curation and model iteration.
This representation-first explainability approach is central to how we think about debugging complex end-to-end systems at Tensorleap: making internal model behavior observable, comparable, and actionable so issues can be addressed before they surface in closed-loop driving.
.png)
Identifying Critical Failure Modes in Deep-Learning Models
Deep-learning models don’t fail randomly. They fail systematically.
They look solid on benchmarks. They pass validation. And then, once deployed, they break in consistent, repeatable ways that aggregated metrics rarely expose.
If this sounds familiar, it’s because many real-world failures don’t show up as “low accuracy.” They show up as patterns:
- A fraud model that performs well overall but keeps missing the same type of fraud
- A vision system that works in most conditions but fails consistently in specific environments
- A model that learns shortcuts- background, context, correlations- instead of the signal you actually care about
From a deep learning debugging and explainability perspective, these aren’t edge cases. They’re critical failure modes.
The problem with averages
Metrics like accuracy flatten everything into a single number. That’s useful, but it also hides the fact that models often underperform on specific subsets of the data, again and again.
These subsets are often called error slices: coherent groups of samples where the model behaves poorly for the same underlying reason. If you don’t find them, you end up:
- Fixing what’s easy instead of what’s important
- Spending R&D cycles on noise
- Shipping models you don’t fully trust
This is where explainability alone falls short. It’s not enough to understand individual predictions- you need ways to systematically surface where and why the model breaks.
What it takes to identify real failure modes
Detecting meaningful error slices is harder than it sounds. A useful approach needs to:
- Recover most systematic failures, not just the obvious ones
- Group errors in a way that makes sense to domain experts
- Look at model behavior from more than a single representation or viewpoint
Recent research has begun to address this problem by proposing representation-based approaches for uncovering hidden correlations and failure patterns. However, there is still a significant gap between what these methods demonstrate in controlled settings and what works reliably in real-world. Bridging this gap requires moving beyond standalone techniques and focusing on how failure analysis integrates into practical evaluation, debugging, and decision-making workflows.
I explored these ideas in more depth in a recent webinar, using concrete examples to show how systematic failures emerge and how different analysis choices shape what you actually discover. If understanding error slices, failure modes, and model behavior beyond aggregate metrics is relevant to your work, the full recording dives deeper into how to approach these problems in practice.
AI-Based Visual Quality Control Fails Quietly- Until It Forces Recalls and Manual Re-Inspection
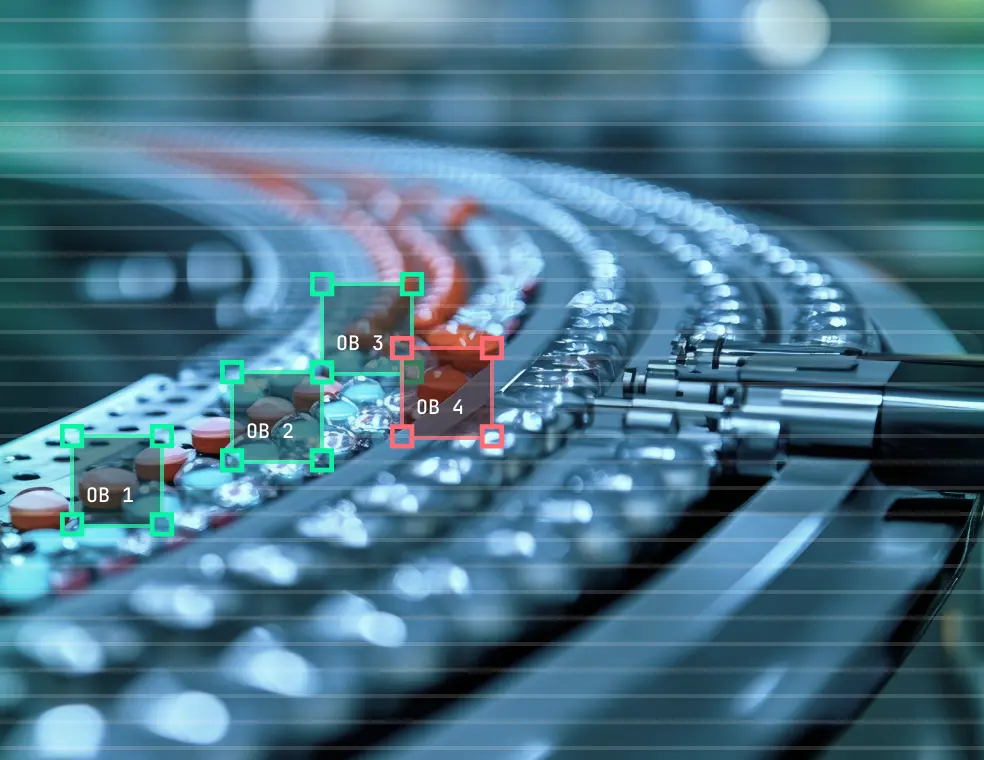
On a production line, while using AI-based visual quality control (QC), you rarely know when a computer vision model is wrong. Without real-time ground-truth labels, drift builds quietly while production continues.
Then a quality escape surfaces, a customer complaint, audit, or yield excursion, and everyone asks the same question: how big is the blast radius? Which lots, stations, or shifts? Since when?
If you can’t answer “since when,” you default to broad containment: widen the quarantine, re-inspect, add manual review. Scrap rises, throughput falls, and trust in automation erodes.
That is the moment of truth in AI-based industrial vision QC- you discover the error only after the damage is done.
Why this happens in real factories
Silent failure is structural because factories do not produce ground-truth labels in real time. You do not get immediate confirmation that a decision was correct. You get feedback later, and it is usually expensive feedback.
Meanwhile, drift is normal factory physics. Lighting angles shift after maintenance. Lenses haze. Fixtures wear. Vibration changes alignment. Operators adjust placement. Suppliers change surface texture or finish. Contamination comes and goes. New SKUs arrive. Line changeovers introduce subtle variation.
Most of this does not look like a crash. It looks like gradual erosion:
- False rejects rise, creating rework loops and throughput friction.
- False accepts creep in, increasing escape risk and warranty exposure.
- Statistical process control (SPC) signals and quality dashboards stay “mostly green” until they do not.
When the model cannot explain itself, teams cannot triage. “Confidence went down” does not tell a quality engineer what to do at 2 a.m. Was it glare, blur, a new texture, a tooling shift, or a labeling policy mismatch? Without a concrete reason, the rational move is broad containment plus manual review.
There is a second kicker. Defects are rare by design. So the next failure mode often arrives before you have ever labeled enough examples of it to recognize it early. And the evidence you need is usually scattered across edge PCs, plants, versions, and partial logs.
Why the usual fixes still leave you exposed
The common responses are rational, and still insufficient.
“Collect more data.”
This sounds right until you realize you are collecting without a hypothesis. If you cannot localize what changed, where, and when, you can gather volume and still miss the exact drift slice that caused the escape. More data is not more control.
“Add more QA layers.”
Manual review gates can reduce escapes, but they add cost and slow the line. Worse, they create a confused operating model: who is accountable, the model or the human? Over time you end up paying for both, and trusting neither.
“Extend the pilot.”
Long pilots do not automatically create trust. They often normalize shadow mode. Human overrides become routine, misclassifications stop being treated as fixable defects in the system, and the organization learns to live with “automation that needs babysitting.”
The missing layer: explainability as a control loop
Computer vision models in manufacturing should be treated like diagnosable production systems, not one-time deployments.
That requires explainability with an operational job: incident response and containment.
When something goes wrong, teams need to answer two questions quickly: What changed? When did it change?
Explainability helps by making a CV model’s behavior legible at the point of failure. Not as a report, and not as a compliance artifact. As a way to connect an escape or yield event to specific visual evidence, conditions, and assumptions so teams can choose the smallest corrective action.
The goal is targeted repair, not “start over” retraining:
- Identify the drift condition or new regime.
- Validate what the model relied on when it made the decision.
- Fix the smallest lever: optics or illumination, a labeling policy, missing data coverage, thresholds, or a model assumption.
- Redeploy with tight version control and regression checks so confidence increases over time instead of resetting every incident.
Operational workflows this enables
When you treat explainability as a control loop, a few concrete workflows emerge:
- Drift-aware inspection maintenance
Detect gradual changes in decision behavior tied to optics, lighting, or fixtures, and trigger maintenance actions before yield or escapes move.
- Lot, shift, and station transfer validation
Quantify domain gaps across lines and plants so you can scale deployments without relearning the same failure modes everywhere.
- Failure-driven data labeling and curation
Label the smallest set of samples that explains the incident, instead of launching open-ended data collection.
- Safe model evolution and regression control
Compare versions behaviorally, not just by aggregate metrics, so teams can ship fixes without gambling on new failure modes.
What this looks like in practice
Example 1: Supplier lot change leads to silent escapes
- Trigger: A new supplier lot introduces subtle surface texture variation.
- What breaks: False accepts rise. A few defects escape to customers. Warranty risk and recall exposure spike.
- What the model relied on: Texture cues that were stable in the old lot, but shifted in the new one.
- Smallest fix: Capture the affected lot slice, label the edge cases, retrain with targeted coverage. Add a lot-level drift check before release.
- Operational change: Containment narrows to specific lots and time windows instead of a broad re-inspection sweep.
Example 2: Lens haze creates “healthy” dashboards and unhealthy output
- Trigger: Optics degrade gradually over days from haze or contamination.
- What breaks: Decisions drift slowly. Escapes increase before alarms trigger. The cost of containment grows because the start time is unclear.
- What the model relied on: Background artifacts and edge noise as focus degraded.
- Smallest fix: Clean or replace optics, set a maintenance trigger based on behavior change, and retrain on degraded-image conditions to harden the model.
- Operational change: Drift stops being invisible. The line gets guardrails that protect yield and reduce emergency quarantine windows.
Control, not perfection
This is not about perfect models. It is about never being blind.
Production lines never stand still: conditions shift by the hour, operators change, equipment wears, lighting drifts, and new SKUs or packaging arrive often. If your visual QC system cannot quickly answer what changed and when, you will eventually pay for it in escapes, over-containment, and a second inspection process nobody trusts.
One way to begin: log your model failures like production incidents. Keep a “failure book” with what happened (what/where/when) plus semantic meaning and explainability evidence that pinpoints the root cause of each failure and the reason behind each decision. Over time, this becomes operational memory you can act on, so you can fix issues without broad quarantine.
If a quality issue shows up tomorrow, would you know what changed and when?
When Robotics Leaves The Lab And Stalls
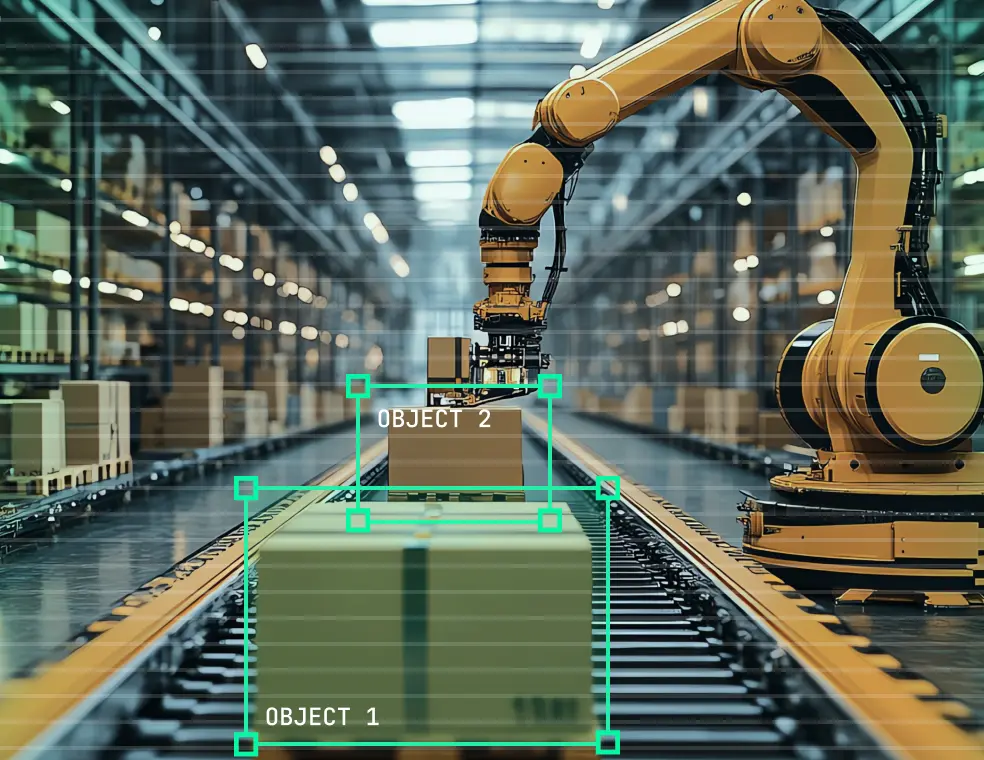
Robotics teams know the pattern. A system performs reliably in controlled pilots, then struggles the moment it reaches a real factory, warehouse, hospital, or site. Pilots stall. Rollouts freeze. Robots remain in assist mode or shadow deployment far longer than planned. Human overrides become routine. Model updates are delayed because no one is confident they won’t break something else.
What looked like a technical success becomes an operational risk. Production teams lose trust. Safety teams tighten constraints. ROI projections quietly expire. The issue is rarely ambition or belief in robotics- it’s the growing gap between how systems behave in the lab and how they behave when exposed to real environments, real wear, and real people.
Where things break in the real world
Once deployed, robotics systems begin to fail in familiar ways.
Sensors drift. Camera calibration degrades. LiDAR noise profiles shift. Lighting changes across shifts, seasons, and facilities. Models that worked on one line or SKU struggle on the next. Minor layout changes, clutter, or human traffic introduce edge cases no one trained for.
These failures rarely arrive as clean crashes. Performance erodes. False positives increase. Task success rates quietly drop. Operations escalate issues that engineering cannot easily reproduce. Logs show anomalies, not causes.
The robot is still “working”- just not reliably. And because the degradation is gradual, it often goes unnoticed until uptime, safety margins, or throughput are already impacted.
The moment teams realize they’re flying blind
Eventually, a failure occurs that no one can confidently explain.
Was it sensor drift or environment change? A perception gap or a logic error? A data issue or a control issue? The team replays logs, inspects frames, reruns simulations. Nothing clearly points to why the robot behaved the way it did.
At that point, teams confront a harder truth. They can see what happened, but they don’t understand why. They lack causal insight into model behavior, limited ability to intervene safely, and little confidence that the next deployment- or update- won’t introduce a new failure elsewhere.
That’s when progress slows, not because the system can’t improve, but because the team can’t reason about it.
The missing layer in today’s robotics AI stack
Simulation, offline metrics, and task success rates are necessary- but insufficient. What’s missing is an engineering feedback loop between robot behavior and the data and assumptions that drive it.
This is where advanced explainability enters- not as visualization or compliance tooling, but as a control layer for robotics systems.
When applied correctly, explainability enables four critical capabilities:
- Concept and attribution analysis: Understanding what visual, spatial, or sensor concepts the robot actually relies on when acting- and whether those align with engineering intent.
- Domain gap and data coverage analysis: Identifying where real deployment conditions violate training assumptions before failures scale.
- Behavior monitoring in production: Detecting gradual drift in perception or decision-making as sensors age and environments evolve.
- Closed-loop automation: Using insights to drive concrete corrective actions- dataset curation, domain adaptation, synthetic data generation, validation, and redeployment.
This layer doesn’t replace existing tools. It connects them. It turns opaque behavior into actionable signals.
From insight to control: a different development paradigm
With this control layer in place, the robotics development cycle changes.
Failures are traced to specific sensors, concepts, or environments- not guessed at. Drift is detected early, not after operational impact. Model updates are driven by evidence, not fear of regression.
Instead of freezing deployments, teams iterate safely. Instead of firefighting, they close loops: detect → explain → correct → validate. The robot becomes a system that adapts deliberately, not one that silently degrades.
This paradigm adds four operational workflows:
- Drift-aware perception maintenance: Continuously detect sensor and perception drift in production and trigger targeted recalibration or data refresh before performance degrades.
- Site-to-site domain transfer validation: Quantify domain gaps between deployment environments to safely adapt models across factories, warehouses, and facilities.
- Failure-driven dataset curation: Trace recurring failures to missing data regimes and curate only the data needed to correct behavior without over-collecting.
- Safe model evolution and regression control: Validate behavioral changes between model versions to deploy fixes confidently without introducing new failures.
Together, these workflows directly address the pains teams face today: stalled pilots, fragile autonomy, and the constant tradeoff between progress and operational risk.
What changes for teams that get this right
Teams that adopt this paradigm scale beyond pilots faster. They experience fewer production incidents and regain confidence in autonomy. Model updates become routine instead of risky. Robots remain reliable longer, even as environments change.
Most importantly, robotics stops being a collection of brittle deployments and becomes a managed, evolving capability- one that production, safety, and engineering teams can all trust.
A practical next step
Start small. Pick one deployed system and ask a simple question: If this robot fails tomorrow, would we know why?
Assess where sensor drift, domain gaps, or silent degradation could already be happening. Identify whether insights today lead to concrete corrective actions- or just alerts.
You don’t need a full overhaul to begin. But you do need to look at your robots through the lens of control, not just performance.
That shift alone changes what’s possible.

ICCV Decoded: Explainability Through Model Representations
As someone deeply involved in deploying deep learning systems to production, I keep encountering the same challenge: models can be highly accurate and still fundamentally difficult to trust. When they fail, the reasons are often opaque. Internal representations are hard to reason about, hidden failure modes emerge late, and many post-hoc explainability tools stop at surface-level signals without answering a more fundamental question: what has the model actually learned?
This question was very much on my mind at ICCV, where I attended a talk by Thomas Fel. His presentation immediately stood out. The way he covered the space- both technically and philosophically- was precise, rigorous, and deeply thoughtful. He framed interpretability not as a visualization problem or an auxiliary debugging step, but as a way to reason about models at the level where decisions are formed: their internal representations. That framing resonated strongly with me.
Interpreting models through internal representations
In his NeurIPS 2023 paper, Thomas and his co-authors introduce Inverse Recognition (INVERT), a method for automatically associating hidden units with human-interpretable concepts. Unlike many prior approaches, INVERT does not rely on segmentation masks or heavy supervision. Instead, it identifies which concepts individual neurons discriminate and quantifies that alignment using a statistically grounded metric. This enables systematic auditing of representations, surfacing spurious correlations, and understanding how concepts are organized across layers- without distorting the model or making causal claims the method cannot support.
From research insight to applied practice
This line of work aligns closely with how we think about applied explainability at Tensorleap. For practitioners, interpretability only matters if it leads to action: better debugging, more reliable validation, and clearer decision-making around models in real systems. Representation-level analysis addresses a critical gap- cases where a model appears to perform well, but for the wrong reasons.
Beyond the research itself, Thomas is also a remarkably clear and insightful speaker. That was a key reason I invited him to join us for a Tensorleap webinar. Our goal was not to simplify the research, but to explore how these ideas translate into practical insight for engineers working with complex models in production.
If you’re grappling with understanding what your models have learned, or why they fail in unexpected ways, I strongly recommend watching the full webinar recording to dive deeper into representation analysis and applied interpretability.
Uncovering Hidden Failure Patterns In Object Detection Models
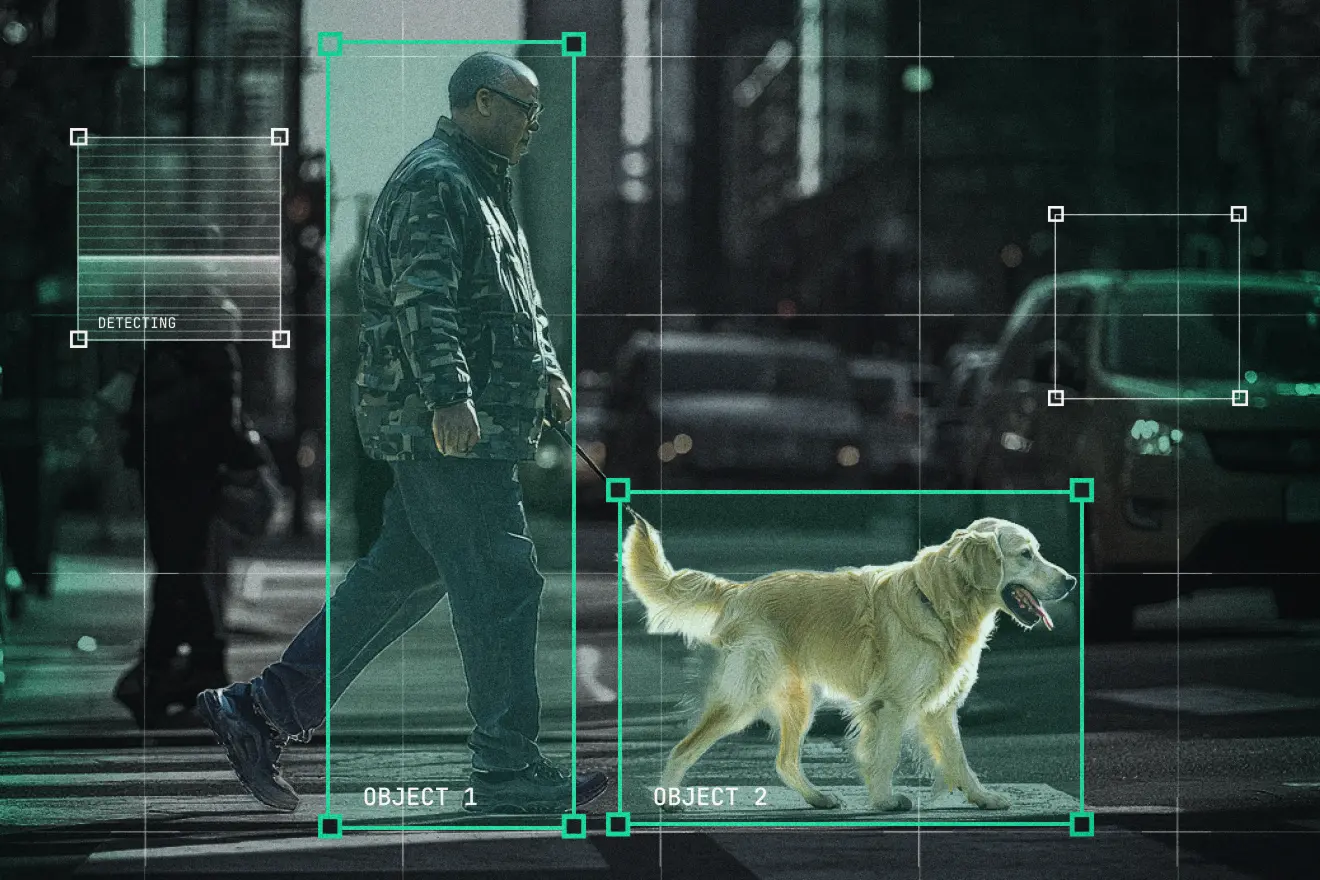
Modern object detection models often achieve strong aggregate metrics while still failing in systematic, repeatable ways. These failures are rarely obvious from standard evaluation dashboards. Mean Average Precision (mAP), class-wise accuracy, and loss curves can suggest that a model is performing well- while masking where, how, and why it breaks down in practice.
In this post, we analyze a YOLOv11 object detection model trained on the COCO dataset and show how latent space analysis exposes failure patterns that standard evaluation workflows overlook. By examining how the model internally organizes data, we uncover performance issues related to overfitting, scale sensitivity, and inconsistent labeling.
Why aggregate metrics fail to explain model behavior
Object detection systems operate across diverse visual conditions: object scale, occlusion, density, and annotation ambiguity. Failures rarely occur uniformly; instead, they cluster around specific data regimes.
However, standard evaluation metrics average performance across the dataset, obscuring correlated error modes such as:
- Over-representation of visually simple samples during training
- Systematic degradation on small objects
- Conflicting supervision caused by inconsistent labeling
Understanding these behaviors requires analyzing how the model represents samples internally-not just how it scores them.This analysis was conducted using Tensorleap, a model debugging and explainability platform that enables systematic exploration of latent representations, performance patterns, and data-driven failure modes.
How latent space reveals structured model behavior
Deep neural networks learn internal representations that encode semantic and spatial structure. In object detection models, these latent embeddings determine how different images are perceived as similar or different by the model.
By projecting these embeddings into a lower-dimensional space and clustering them, we can observe how the model organizes the dataset according to its learned features.
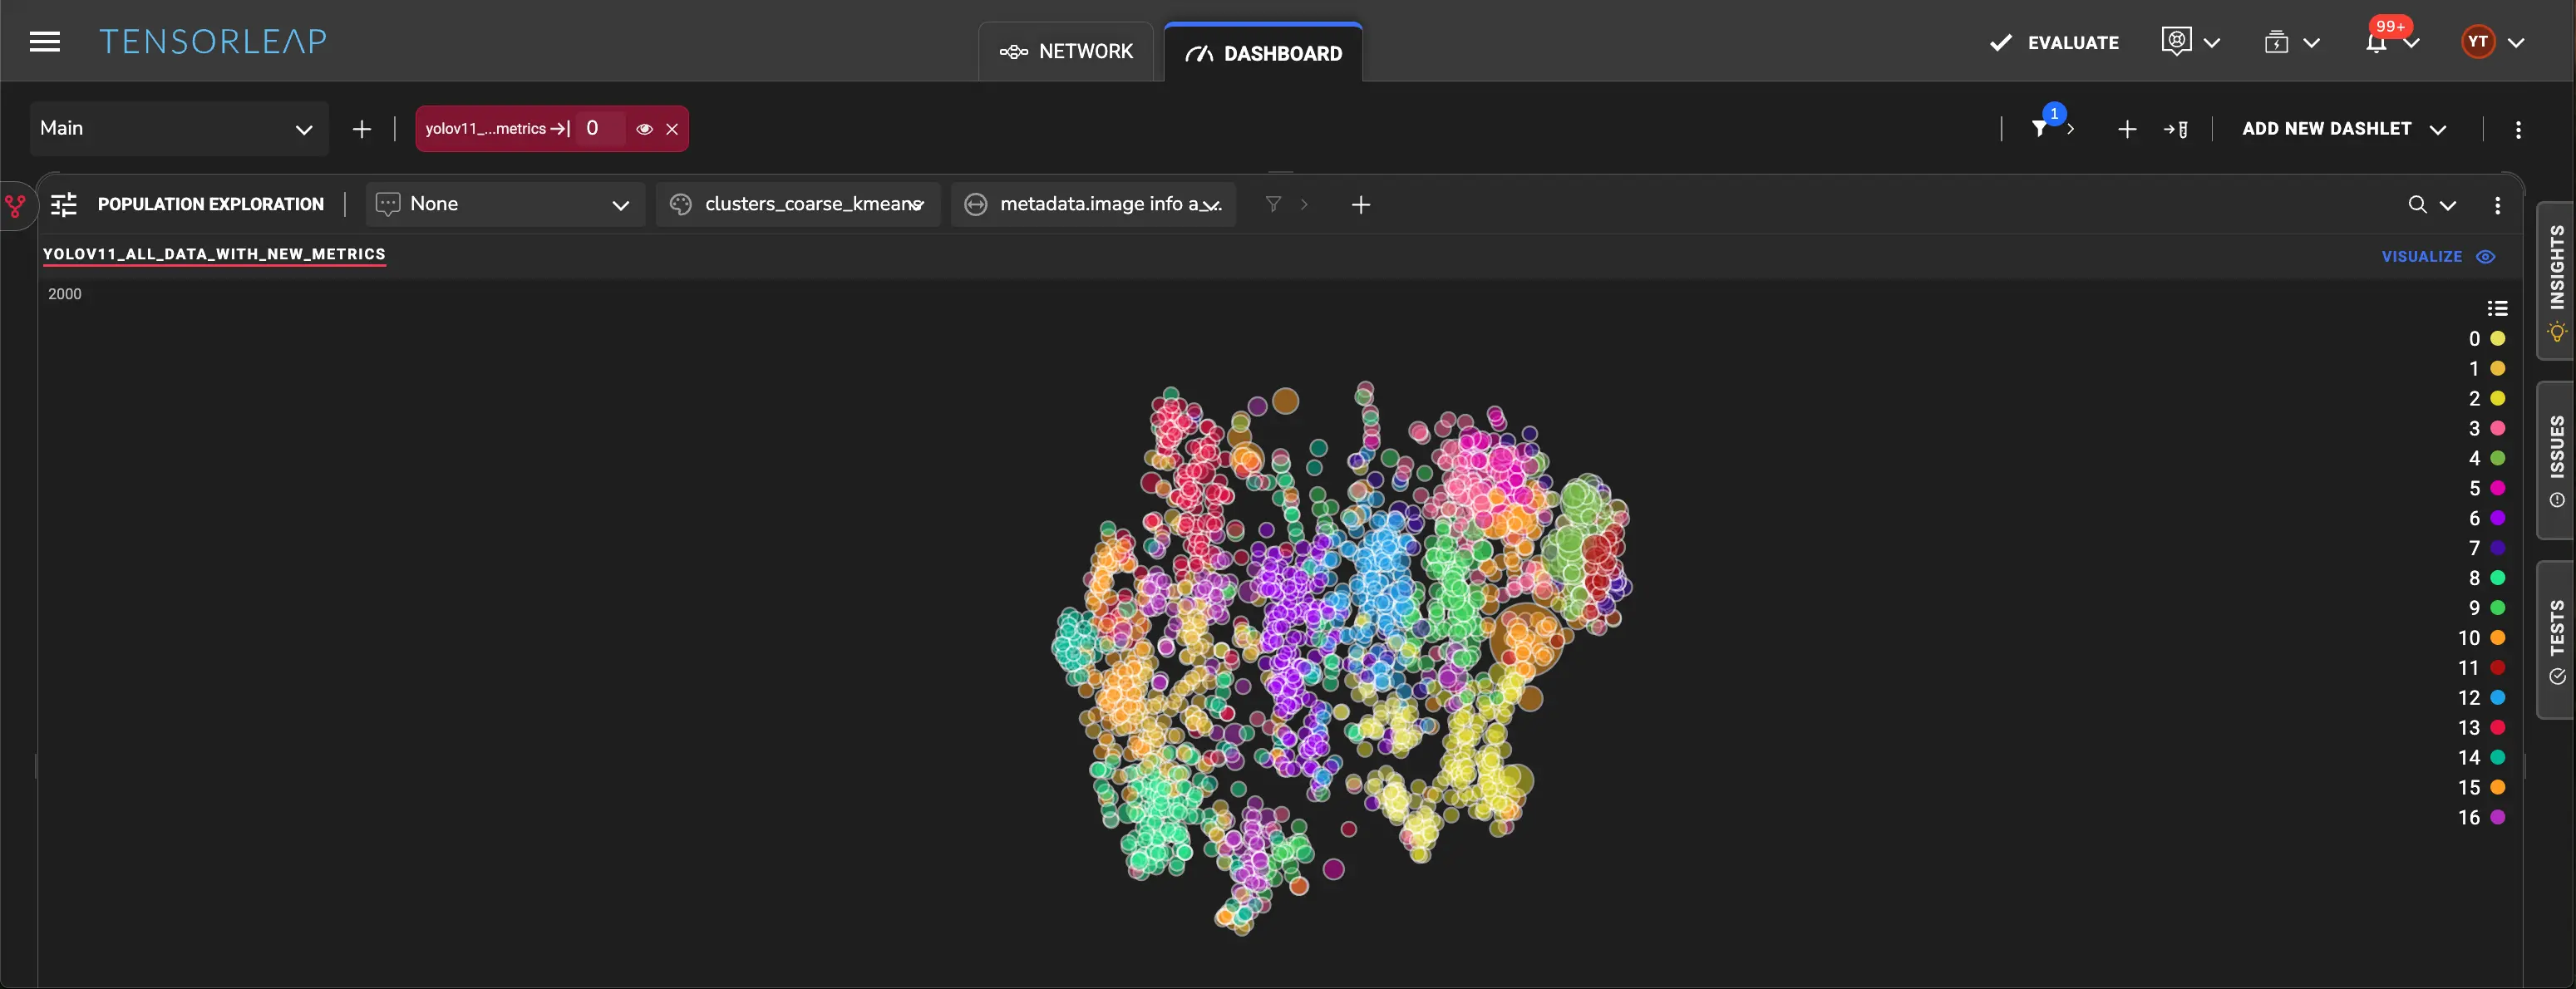
Clusters in this space often correspond to shared performance characteristics. Regions with elevated mean loss or skewed data composition point to systematic failure modes rather than isolated errors.
Over-representation and overfitting in simple training samples
One prominent cluster is dominated by images containing train objects with minimal occlusion on training samples compared to validation samples. When the latent space is colored by the number of train objects per image, this region becomes immediately apparent.
.webp)
This cluster exhibits low bounding box loss on the training set but significantly higher loss on validation data. The samples are strongly correlated with low occlusion, indicating that they represent visually “easy” cases.
The imbalance suggests that the model has overfit to these simple examples, memorizing their patterns rather than learning features that generalize. When validation samples deviate slightly, such as containing higher object overlap, performance degrades sharply.
Scale-dependent failure on small objects
A separate low-performance region emerges when the latent space is examined alongside bounding box size statistics. Samples dominated by small objects consistently show higher loss values.
Qualitative inspection of samples from this region confirms the pattern: the model reliably detects large objects while frequently missing smaller ones in the same scene. This behavior is reinforced by a clear trend in the data- loss increases as object size decreases.
Rather than sporadic errors, small-object failures appear as a structured limitation tied to how the model represents scale internally.
Labeling inconsistency and semantic ambiguity
Another low-performing cluster is dominated by images containing books. Coloring the latent space by the number of book instances reveals a strong concentration of such samples.
Inspection of these images exposes multiple labeling inconsistencies:
- Some visually identical books are annotated while others are not
- Books are sometimes labeled individually and other times as grouped objects
- Similar visual scenes receive conflicting supervision signals
Layer-wise attention analysis further reveals that earlier layers focus on individual books, while final layers often collapse attention onto entire shelves. This mismatch suggests that fine-grained representations exist internally but are not consistently reflected in final predictions.
.webp)
As the number of books per image increases, loss rises accordingly, reinforcing the conclusion that labeling ambiguity directly degrades model performance.
Why these latent failure patterns matter
These findings highlight a fundamental limitation of aggregate evaluation metrics: they describe how well a model performs on average, but not where or why it fails.
Latent space analysis exposes:
- Overfitting driven by data imbalance
- Scale-sensitive performance degradation
- Supervision noise caused by inconsistent annotations
Crucially, these issues emerge as structured patterns across groups of samples, not as isolated mistakes.
Seeing model failures the way the model does
Object detection models can appear robust while harboring systematic weaknesses that only surface under specific conditions. By analyzing latent space structure and correlating it with performance and metadata, we can uncover hidden failure patterns and trace them back to data properties and representation gaps.
This shifts model debugging from reactive error inspection to evidence-based understanding, grounded in how the model actually perceives the dataset.
.webp)
Finding the Data That Breaks Your Pose Estimation Model
When pose estimation models fail, the reasons are rarely obvious. Aggregate metrics smooth over structure, and manual inspection of individual samples often leads to intuition-driven guesswork rather than understanding.
This is a recurring challenge in deep learning debugging: knowing not just where a model fails, but what it has learned, and how those learned concepts influence performance and behavior.
Tensorleap addresses this challenge by creating a visual representation of the dataset as seen by the model itself. By analyzing internal activations, Tensorleap reveals how the model interprets data, uncovers the concepts it has learned, and connects those concepts directly to performance patterns.
In this post, we analyze a pose estimation model trained on the COCO dataset, showing how latent space analysis exposes hidden failure patterns that systematically degrade model performance.
How the model sees the dataset
Before debugging failures, it helps to start with a more fundamental question: How does the model internally organize the data it learns from?
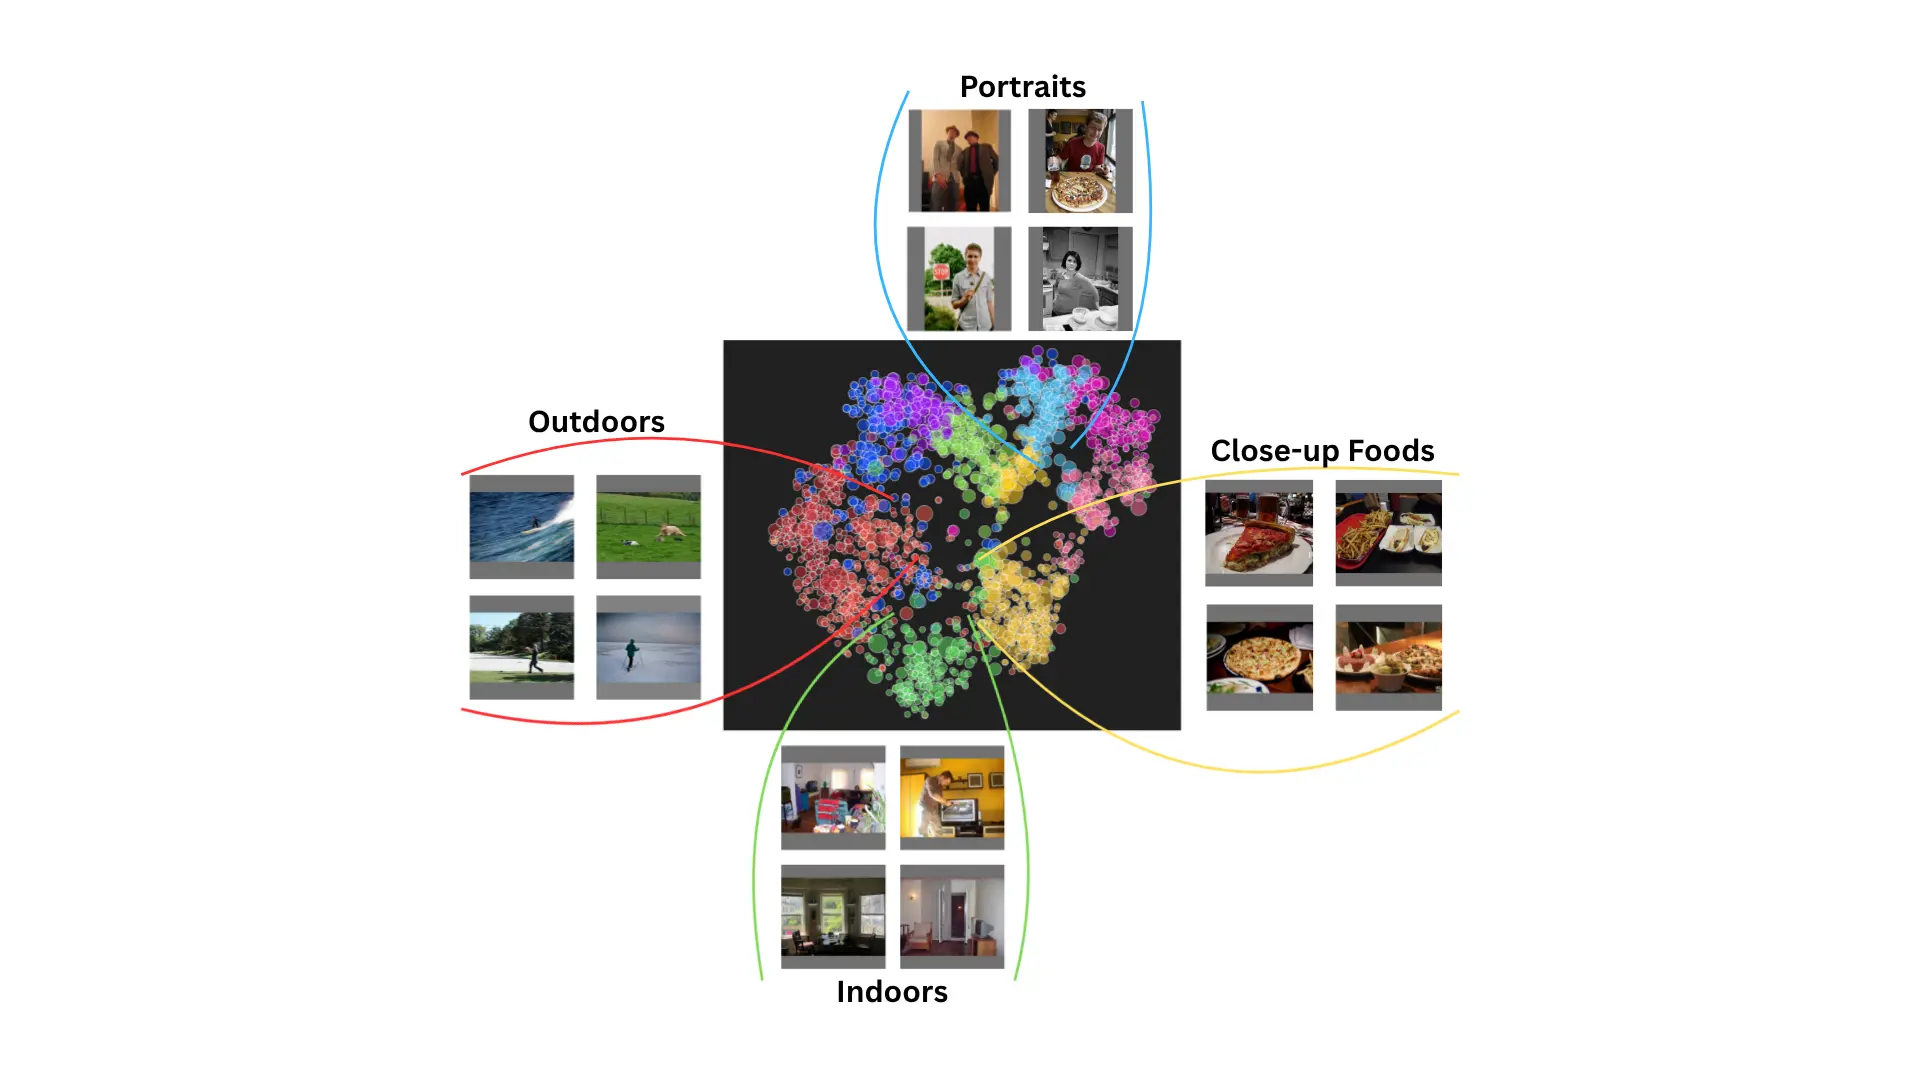
Tensorleap captures activations across the model’s computational graph and embeds each input sample into a high-dimensional latent space. This space is then projected into an interpretable visual representation, where proximity reflects similarity in how the model processes images.
In effect, this creates a map of the dataset from the model’s point of view- revealing how inputs are grouped based on learned representations rather than labels or predefined rules.
From latent space to learned concepts
Once the latent space is constructed, samples are automatically clustered based on their learned representations. These clusters reflect concepts learned by the neural network, not categories imposed by the dataset.
Overlaying dataset metadata on this space reveals strong semantic alignment. For example, indoor scenes containing household objects naturally group together, confirming that the latent space encodes meaningful semantic structure.
.webp)
Identifying performance aggressors
Each latent cluster is linked to performance metrics, loss components, and dataset metadata. Clusters that contribute disproportionately to error are identified as performance aggressors- groups of samples that actively degrade model behavior during training and inference.
Below, we examine two such aggressors uncovered in the pose estimation model.
Aggressor #1: close-up images driving false positives
One cluster exhibits classification loss more than twice the dataset average.
.webp)
This cluster is dominated by close-up images with heavy occlusion, including food on tables and pets such as cats. Most images contain no people, and when humans do appear, they are often partially visible.
Despite this, the model frequently predicts the presence of a person. Loss spikes most sharply in images with zero people, indicating a systematic bias toward positive human detection.
Why this matters:
This cluster does not represent isolated errors. These samples disproportionately influence classification loss and reshape the decision boundary, reinforcing false positives during training.
Isolating this cluster makes it possible to reason about how close-up, non-human imagery biases the classifier and to evaluate whether these samples should be treated differently during analysis or training.
Aggressor #2: crowded scenes with inconsistent pose labels
Another cluster shows degradation across all loss components: classification, bounding boxes, pose, and keypoint estimation.
.webp)
These samples correlate strongly with sports and stadium scenes containing both players and spectators. Inspection of annotations reveals that many visible people are partially or entirely unlabeled for pose.
Comparing object-detection and pose annotations shows a median gap of 13 people per image, exposing inconsistency in what constitutes a labeled subject. Activation heatmaps confirm that the model attends to both labeled players and unlabeled spectators, leading to contradictory training signals.
Why this matters:
Performance degradation in these scenes is driven by label inconsistency, not pose complexity. Without distinguishing between the two, errors in crowded environments are easily misattributed to difficult motion or insufficient model capacity.
From insights to action
These failure patterns share three characteristics:
- They are systematic
- They are high-impact
- They are invisible to aggregate metrics
By visualizing how the model interprets the dataset and linking learned concepts to performance, teams gain a grounded understanding of why models fail and where deeper investigation is required.
This approach enables more informed decisions around data inspection, targeted analysis, and follow-up experimentation.
Bottom line
Pose estimation models do not fail randomly- they fail in patterns shaped by data, labels, and learned representations.
By creating a visual representation of how the model sees the data, Tensorleap uncovers hidden failure patterns and reveals the dataset concepts that most strongly affect performance.
When metrics stall and intuition runs out, the answer is often already there- embedded in the model’s latent space.

Fixing Deep Learning Models Failures With Applied Explainability
What’s most frustrating? The problem often isn’t your technical skills or the model’s potential. It’s the way the neural network operates that’s holding you back.
This is where Applied Explainability comes in. In this post, we’ll walk you through how to embed Applied Explanability across the deep learning lifecycle, transforming black-box models into transparent, reliable, and production-ready systems.
What is so hard to build and deploy deep learning models?
Customers, stakeholders and leaders all want AI and they want it now. But developing and deploying reliable and trustworthy neural networks, especially at scale can feel like fighting an uphill battle.
- The models themselves are opaque, making it hard to trace errors or understand why a prediction went wrong.
- Datasets are often bloated with irrelevant samples while critical edge cases are missing, hurting accuracy and generalization.
- Labeling is expensive and inconsistent
- Without proper safeguards, models can easily reinforce bias and produce unfair outcomes.
- Even when a model reaches production, the challenges don’t stop. Silent failures creep in through distribution shifts, or edge cases, and debugging becomes reactive and fragile.
What is applied explainability and how does it work?
Applied Explainability is a broad set of tools and techniques that make deep learning models more understandable, trustworthy, and ready for real-world deployment. By analyzing model behavior in depth, the reasons they fail and how to fix them, Applied Explainability allows data scientists to debug failures, improve generalization, and optimize labeling and dataset design. With Applied Explainability, teams can proactively detect failure points, reduce labeling costs, and evaluate models at scale with greater confidence.
Applied Explainability is woven throughout the deep learning pipeline, from data curation and model training to validation and production monitoring. When integrated into CI/CD workflows, it enables continuous testing, per-epoch dataset refinement, and real-time confidence monitoring at scale. The result? More structured, efficient, and reliable deep learning development.
Integrating applied explainability into deep learning dev pipelines
Applied Explainability isn't a post-production, monitoring analysis that is nice-to-have. Rather, it’s a mandatory active layer that should be integrated throughout the deep learning dev lifecycle:
Step 1: Data curation
Training datasets are often lacking: they can be repetitive, incomplete or include inaccurate information. Applied Explainability allows teams to prioritize which samples to add, re-label, or remove to construct more balanced and representative datasets, while saving significant time and resources on labeling, ultimately improving model performance and generalization.
This is done by analyzing the model’s internal representations, uncovering underrepresented or overfitted concepts in the dataset and calculating the most informative features, while finding the best samples for labeling to improve variance and representations.
Step 2: Model training
Training does not provide reliable generalization, which is required for ensuring production reliability. Applied Explainability enables automated adjustments to the dataset while training is in progress, such as removing redundant samples, exposing unseen populations, or targeting weak generalization areas. The result is faster convergence, better generalization, and fewer wasted cycles on uninformative data.
This is done by continuously refining the dataset and training process based on the model’s evolving understanding. It tracks activations and gradients during each training epoch to detect which features and data clusters the model is learning or overfitting.
Step 3: Model validation
The model might pass validation metrics, but fail catastrophically on edge cases. Applied Explainability enables a deeper, more structured validation process. Teams can pinpoint not just if the model works, but where, why, and for whom it does or doesn’t.
It breaks down model performance across the concepts, identified in the latent space. Each subset is tracked using performance indicators and feature data, all indexed in a large database.
When a new model is introduced, the system compares its performance across these concepts, especially identifying where it performs better than older models. It helps detect clusters where the model consistently fails or overfits, tracks mutual information to assess how generalizable learned features are, and compares current model behavior against previous versions.
Step 4: Production monitoring
Failures happen in production and data scientists don’t know why or how to fix it. Applied Explainability gives teams visibility into the model’s performance holistically, providing an understanding of why the model failed.
When a failure occurs, it simulates where similar issues might arise in the future by grouping failing samples with identical root causes to evaluate the model’s quality and generalization. It also explores a model’s interpretation of each sample, identifies main reasons for the prediction and indexes and tracks performance across previously identified failure-prone populations, allowing teams to monitor whether new models fix past issues or reintroduce them.
How applied explainability helps develop and deploy reliable deep learning models
The Applied Explainability impact:
- Faster development cycles- by identifying data issues, feature misbehaviors and edge-case failures early in the workflow, teams reduce back-and-forth debugging and costly retraining. This accelerates iteration loops, shortens time-to-deploy, and reduces the number of retraining cycles.
- Control and clarity- for data scientists under pressure to deliver accurate, fair, and defensible models, Applied Explainability offers reassurance. It makes development and deployment easier and helps build trust not just in the model, but in the data scientist’s work, making it easier to stand behind their decisions with confidence.
- Visibility, explainability, and transparency- data scientists get clear insights into why a model made a prediction, where it fails, and how it evolves across training and production. This transparency builds trust among stakeholders and speeds up incident investigation.
- Saving resources in engineering & labeling- Applied Explainability saves engineering time on unexplainable bugs. It reveals mislabeled data, overfit regions, and redundant or unnecessary features, helping teams optimize datasets and reduce manual labeling.
- Enhanced confidence in the deployed model- engineers, data scientists and business stakeholders can validate that the model is behaving reasonably, fairly and robustly, even under rare or critical conditions, and without surprise failures in production. This results in higher model adoption, especially for critical scenarios, fewer rollback risks, and better alignment with business and user expectations.
- Scalability and generalization- by analyzing behavior across diverse data clusters, Applied Explainability ensures the model generalizes well, not just on test data, but across real-world populations and unseen cohorts.
From guesswork to guarantees: make deep learning work at scale
Applied Explainability bridges the gap between deep learning models that break in production and robust systems that operate with confidence. If you’re tired of flying blind with black-box models, it’s time to bring Applied Explainability into the heart of your workflow. Learn how with Tensorleap.
